At the Federal Reserve’s annual August Jackson Hole retreat, Federal Reserve Chairman, Jerome Powell, reiterated the Federal Reserve’s stance that “a gradual process of normalization remains appropriate”. Unfortunately, the path to “normalization” is fraught with the consequences of unwinding the capital flows that resulted from the post 2008 extreme monetary policy measures. As we have pointed out in the past, the Federal Reserve typically raises rates until the next crisis hits and then turns tail. Whether the accelerating stress in emerging markets is that crisis or the global economy rolling over with a bit of help from trade wars, it is clear the risk profile for investors is increasing, in our opinion. The equity bull market has reached the longest on record and consumer confidence is hitting levels that historically has signaled a major turn down may be close at hand.
Our list of gold catalysts highlights some of the known risks that may cause the Federal Reserve to pause “normalization” or revert to another round of Quantitative Easing.
Gold Price Catalyst Considerations
- Negative consequences of extreme monetary policies starting to play out.
- Emerging market stress spreading from Turkey, Argentina and Brazil as rising interest rates and stronger dollar squeeze borrowers of dollars. Italy and Spain could be in the crosshairs.
- Foreign bank exposure to Turkey $265 billion according to Bank of International settlements (BIS)1 with Spanish banks holding $81 billion in exposure followed by France with $38 billion. Spanish banks also have $28 billion exposure to Argentina.
- In an ominous sign, the spread between German and Italian ten-year bonds has doubled recently, breaking a long downtrend.
- India’s central bank governor calls for Federal Reserve to stop raising interest rates and shrinking balance sheet at a time of rising U.S. deficits as it is absorbing too much global liquidity threatening a financial crisis.
- Philadelphia Federal Reserve survey shows inflationary expectations rising.
- Inflationary pressures heat up with metropolitan (Los Angeles, Atlanta, Dallas and Boston) inflation running at or above 4%.
- Federal Reserve likely to stay firmly behind inflation curve.
- U.S. Treasury yield curve2 flattening with expectations of inversion with next increase in Federal Funds rate in September.
- All past nine recessions/bear markets associated with yield curve inversion.
- Average bear market decline 33% lasting 16.7 months.
- International Institute for Finance (IIF) 3 reports total global debt has increased 74% over the past ten years to $247 trillion and a staggering 318% of GDP.
- Borrowing binge highlighted by major increase in sovereign and corporate debt.
- U.S. national debt reaches $21.2 trillion up $12 trillion in ten years and is on an exponential path higher.
- U.S. faces a potential debt spiral if interest rates revert to 40-year mean and climb to 5.7%.
- Trump tax reform adds to deficit spending at a time of increased entitlement liabilities with baby boomers retiring.
- Gold prices in the post gold standard era have 90% correlation over time to total federal debt outstanding.
- U.S. Consumer debt and servicing at record levels.
- CRB4/S&P 5005 ratio reaches levels not seen since June 1999 and the second lowest in post gold standard era.
- “Stuff” vs. financial assets historically cheap.
- Sentiment toward financial assets reaches Nasdaq6 bubble level of 2000 as consumer confidence reaches 18-year high.
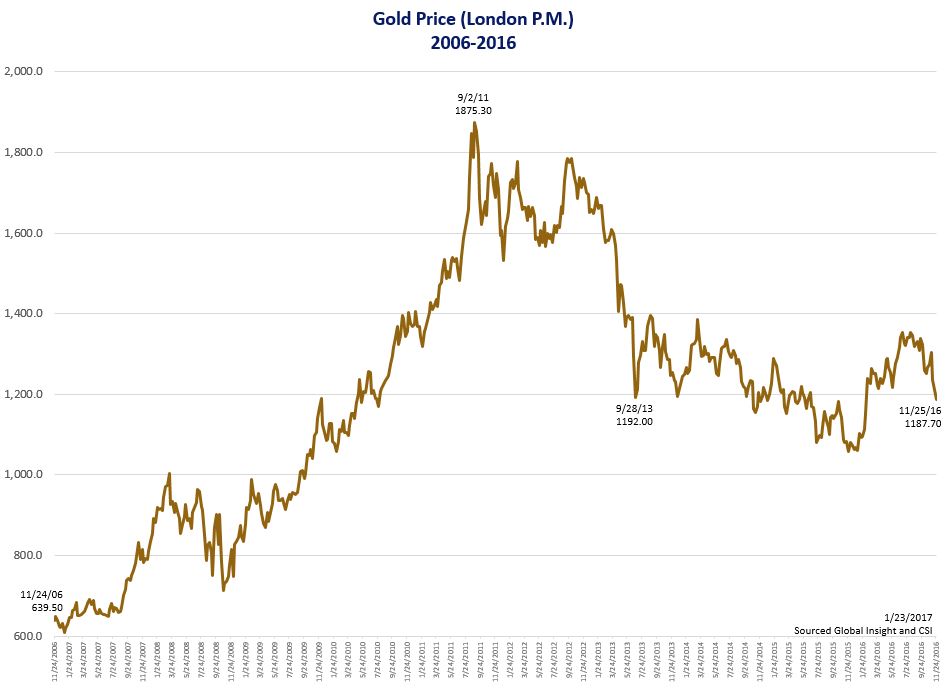
- Conversely, negative sentiment toward gold at levels not seen since the gold price lows in 2000/2001.
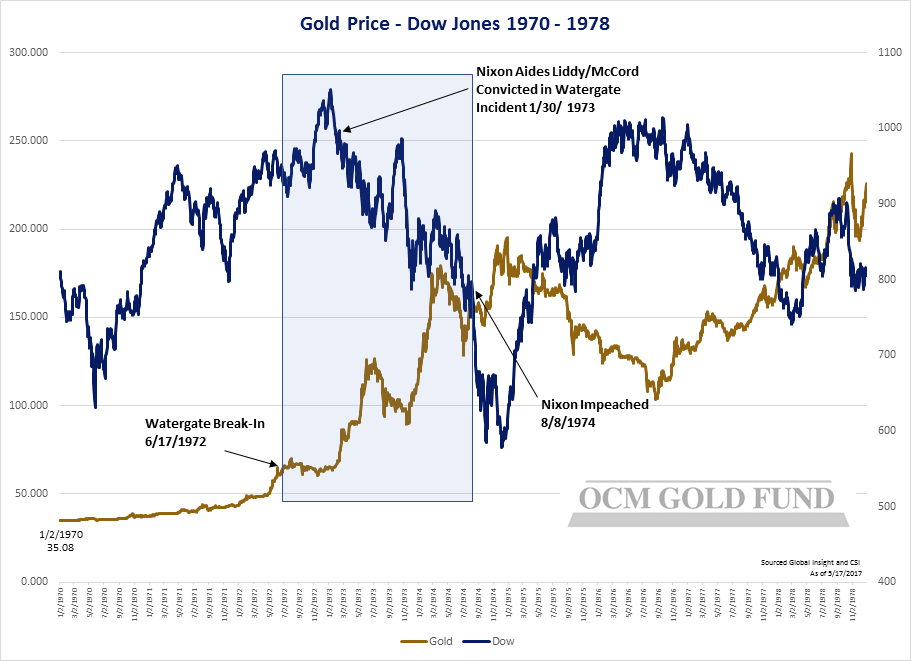
- U.S. Conference Board Consumer Confidence Index7 in “Danger Zone”. Historically, major buy zones for gold and gold mining shares at points of red arrows in 1970 and 2001.
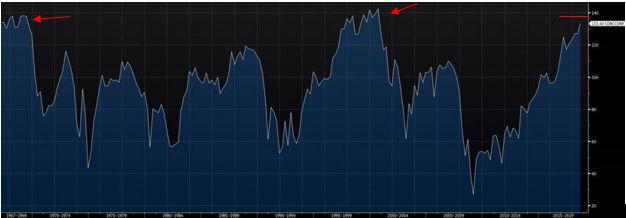
Data Source: www.conference-board.org/data/consumerdata.cfm
- Commodity Futures Trading Commission (CFTC)8 Commitment of Traders positioning shows speculators and managed money short gold futures contracts to levels not seen since 2001 and $275 gold. CFTC extreme spec and managed money positions have proven to be on the wrong side of the trade historically.
- Commercial traders have lowest number of contracts net short since December 2015 gold price low at $1050. Commercials are considered “smart” money and specs “dumb” money.
- Interestingly, commercial longs and speculative shorts are at extremes in the ten-year Treasury note futures.
- Growing list of nations looking to “De-Dollarize” led by China, Russia and Iran.
- Germany leads effort for alternative money transfer system to SWIFT9.
- Russia sells entire portfolio of U.S. Treasury securities. Monthly gold purchases continue unabated.
- India’s central bank adds gold in July for first purchase since 200-ton purchase in 2009.
- Election of socialist Alexandria Ocascio-Cortez in New York highlights potential shift in U.S. politics toward socialist agenda in November mid-term elections as far left base gets energized.
Hypothetical Diversification Chart
Since there are several parallels to 2000/2001, it is worth showing our S&P 500/OCMGX Hypothetical Diversification Chart. Note the benefit of owning OCMGX in a portfolio during the ten-year periods starting 2000/2001. Obviously, past performance does not guarantee future returns.
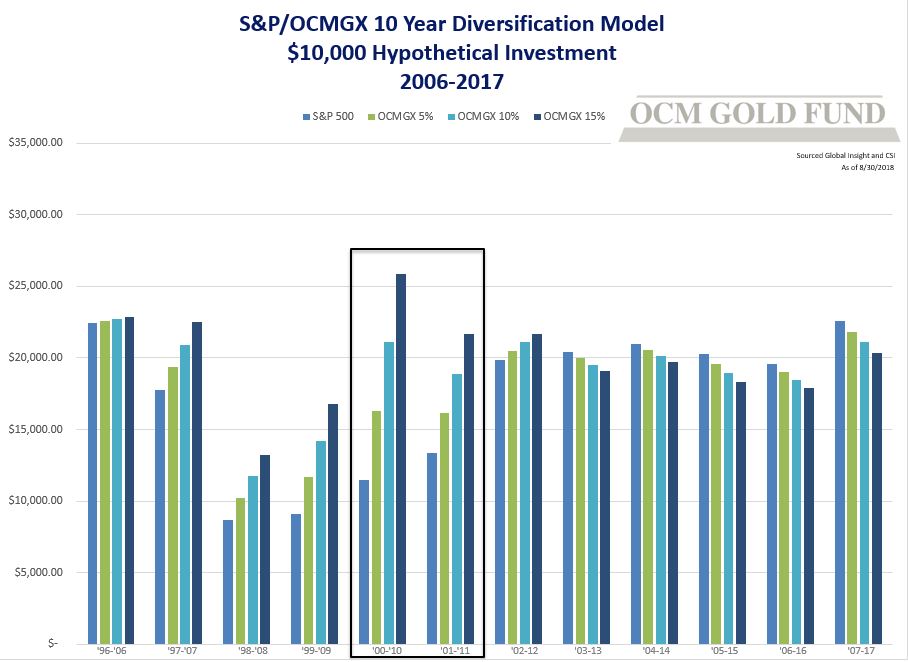
S&P: $10,000 Hypothetical Investment with no diversification
OCMGX 5%: $10,000 Hypothetical Investment 95% S&P 500/5% OCMGX
OCMGX 10%: $10,000 Hypothetical Investment with 90% S&P 500/10% OCMGX
OCMGX 15%: $10,000 Hypothetical Investment with 85% S&P 500/15% OCMGX
OCM Gold Fund Performance – Click HERE or paste this URL into your browser – http://ocmgoldfund.com/performance/
| One Year | Three Year | Five Year | Ten Year | |
| OCM Gold Fund Investor | ||||
| Without Sales Load | -18.98% | 8.95% | -4.07% | -2.29% |
| With Sales Load | -22.62% | 7.31% | -4.94% | -2.74% |
| S&P 500 | 17.91% | 17.31% | 13.95% | 11.97% |
Investors should carefully consider the investment objectives, risks, charges and expenses of the OCM Gold Fund. This and other important information about a Fund is contained in a Fund’s Prospectus, which can be obtained by calling 1-800-779-4681. The Prospectus should be read carefully before investing. Funds are distributed by Northern Lights, LLC, FINRA/SIPC. Orrell Capital Management, Inc. and Northern Lights Distributors are not affiliated.
The Fund invests in gold and other precious metals, which involves additional risks, such as the possibility for substantial price fluctuations over a short period of time and may be affected by unpredictable international monetary and political developments such as currency devaluations or revaluations, economic and social conditions within a country, trade imbalances, or trade or currency restrictions between countries. The prices of gold and other precious metals may decline versus the dollar, which would adversely affect the market prices of the securities of gold and precious metals producers. The Fund may also invest in foreign securities which involve greater volatility and political, economic, and currency risks and differences in accounting methods. The Fund is non-diversified, meaning it may concentrate its assets in fewer individual holdings than a diversified fund. Therefore, the Fund is more exposed to individual stock volatility than a diversified fund. Prospective investors who are uncomfortable with an investment that will fluctuate in value should not invest in the Fund.
Investments cannot be made in an index. Unmanaged index returns do not reflect any fees, expenses or sales charges.
Past performance is no guarantee of future results.
For more information or to schedule a call with Greg Orrell, Portfolio Manager, please call 1-800-779-4681.
(BIS)1 is a bank for central banks. Founded in 1930, the Bank for International Settlements is the oldest global financial institution and operates under the auspices of international law. But from its inception to the present day, the role of the BIS has been ever-changing as it adapts to the dynamic global financial community and its needs.
The Treasury Yield Curve2, which is also known as the term structure of interest rates, draws out a line chart to demonstrate a relationship between yields and maturities of on-the-run treasury fixed income securities.
The Institute of International Finance, Inc. (IIF)3 is a global association or trade group of financial institutions.
Commodity Research Bureau (CRB)4 is an organization that produces an index that tracks the price movements of 17 commodities.
The S&P 5005 Index, a registered trademark of McGraw-Hill Co., Inc. is a market capitalization-weighted index of 500 widely held common stocks. You cannot invest directly in an index.
Nasdaq6 is a global electronic marketplace for buying and selling securities, as well as the benchmark index for U.S. technology stocks.
The Consumer Confidence Index (CCI)7 Survey is an index by The Conference Board that measures how optimistic or pessimistic consumers are with respect to the economy in the near future.
The Commodity Futures Trading Commission (CFTC)8 is an independent U.S. federal agency established by the Commodity Futures Trading Commission Act of 1974.
SWIFT9 stands for the Society for Worldwide Interbank Financial Telecommunications. It is a messaging network that financial institutions use to securely transmit information and instructions through a standardized system of codes.
7430-NLD-08/31/2018