Headlines:
OCM Gold Fund Investment Strategy Update
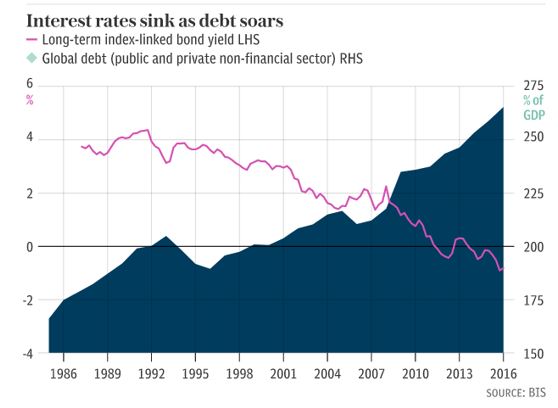
Gold Price – 90% Correlation to Total US Federal Debt over the Past 45 Years
Emerging Market Central Banks Cry Uncle
Fed Hike Cycle History and Gold
OCM Gold Fund Investment Strategy Update
The lack of discovery of large-scale deposits of five million ounces or more over the past fifteen years along with the long lead time from discovery to production means the sweet spot for the gold mining industry to create shareholder value, in our opinion, is in the intermediate and junior producers where per share growth is more easily attainable as new production reverts back to smaller sized deposits and mines. Also in this sweet spot, are major producers with 1.2 to 1.5 million ounces of annual production, such as Agnico Eagle Mines and Randgold as they are not too large to grow per share reserves, production, cash flow and earnings.
We have positioned the OCM Gold Fund with 50% of the portfolio geared toward high quality best in class major producers and royalty companies with a history of delivering on per share metrics and capital discipline. The balance of the portfolio is positioned in intermediate and junior producers with production growth and strong exploration upside rounded out with a number of promising exploration and development companies. In our opinion, the OCM Gold Fund is well positioned to deliver on the performance objectives of its shareholders as capital flows rotate into the gold sector.
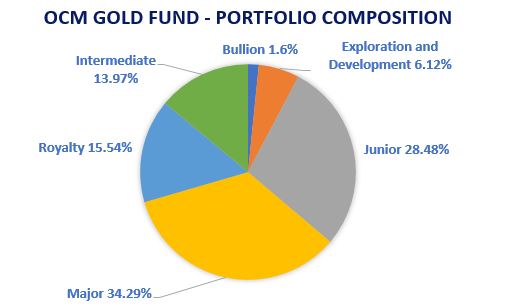
As of 5/31/2018 – Subject to change
Major Producers – Production 1,000,000+ ounces/yr
Royalty – Revenue from royalties or streams on third party operations
Intermediate Producers 250,000 – 1,000,000 ounces/yr
Junior Producers – under 250,000 ounces/yr
Exploration/Development – No current production
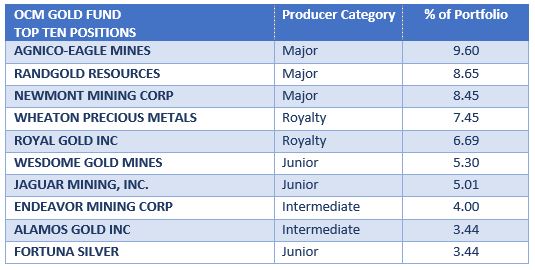
As of 5/31/2018 – Subject to change
The security holdings are presented to illustrate examples of the securities that the fund has bought and the diversity of areas in which the funds may invest, and may not be representative of the fund’s current or future investments. Portfolio holdings are subject to change and should not be considered investment advice.
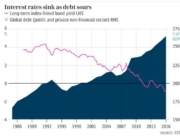
Gold Price – 90% Correlation to Total US Federal Debt over the Past 45 Years
Following the Tax Cuts and Jobs Act, the Congressional Budget Office (CBO) is now projecting total Federal Debt to reach $33 trillion by 2028. CBO ten-year forecasts have historically underestimated future debt levels quite dramatically. In 2008, the CBO projection was for the 2018 total federal debt level to be $12.7 trillion versus actual $21 trillion. Going back a bit further, in 1998, the CBO projection for the 2008 total federal debt of $6 trillion versus $10 trillion. Applying the same consistent level of CBO forecast inaccuracy of the past 20 years, total federal debt could reach $50 trillion in 2028. Whether it is rising interest expense, aging U.S. demographic entitlement spending, or fiscal stimulus in reaction to the next recession or financial crises, the variables are out there for total federal debt to explode upwards. The correlation of total federal debt and the gold price over the past 45 years is 90%.
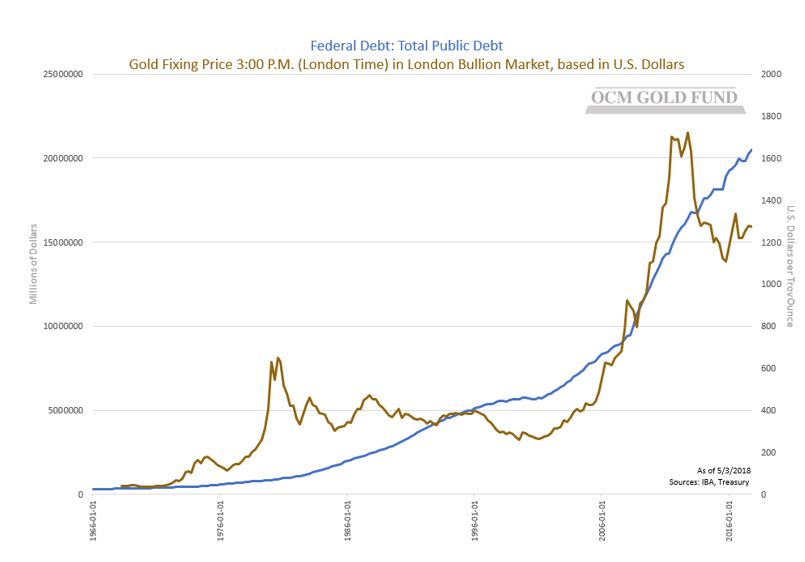
Past performance is no guarantee of future results.
Emerging Market Central Banks Cry Uncle
The collateral damage from the Federal Reserve coming off its zero-interest rate policy was going to start somewhere as the Fed pushed rates higher in attempts to shrink its balance sheet. It is not surprising ground zero is in emerging market currencies that have benefited from the reach for yield. The Turkish lira has collapsed, the Argentine peso, the Brazilian real and list goes on. Last week the International Monetary Fund rescued Argentina with a $50 billion loan package. The Reserve Bank of India Governor, Urjit Patel, wrote in the Financial Times June 4th, 2018, “Given the rapid rise in the size of the US deficit, the Fed must respond by slowing plans to shrink its balance sheet. If it does not, Treasuries will most likely absorb such a large share of dollar liquidity that a crisis in the rest of the dollar bond markets is inevitable.” We continue to believe the fallout from the extreme monetary policies pursued by the Federal Reserve have yet to play out and remains a significant unknown risk. Whether it be inflation or another version of the previous crisis that may be met with even more extreme policy measures that destroy the purchasing power of the dollar.
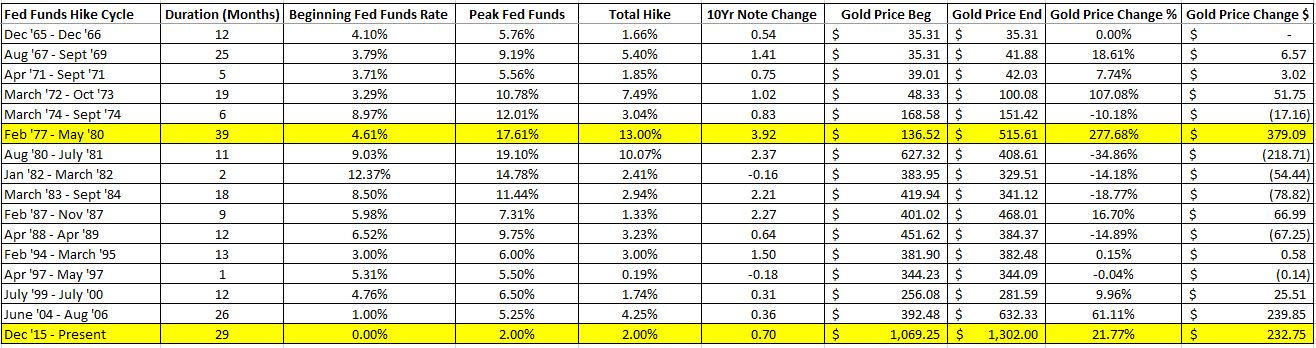
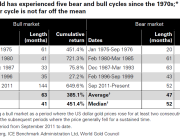
Fed Hike Cycle History and Gold
Current Federal Reserve hike cycle is second longest in terms of duration at 30 months. The longest hike cycle of 39 months was from 1977 to 1980 with gold rising 277% during that period.
Investors should carefully consider the investment objectives, risks, charges and expenses of the OCM Gold Fund. This and other important information about a Fund is contained in a Fund’s Prospectus, which can be obtained by calling 1-800-779-4681. The Prospectus should be read carefully before investing. Funds are distributed by Northern Lights, LLC, FINRA/SIPC. Orrell Capital Management, Inc. and Northern Lights Distributors are not affiliated.
The Fund invests in gold and other precious metals, which involves additional risks, such as the possibility for substantial price fluctuations over a short period of time and may be affected by unpredictable international monetary and political developments such as currency devaluations or revaluations, economic and social conditions within a country, trade imbalances, or trade or currency restrictions between countries. The prices of gold and other precious metals may decline versus the dollar, which would adversely affect the market prices of the securities of gold and precious metals producers. The Fund may also invest in foreign securities which involve greater volatility and political, economic, and currency risks and differences in accounting methods. The Fund is non-diversified, meaning it may concentrate its assets in fewer individual holdings than a diversified fund. Therefore, the Fund is more exposed to individual stock volatility than a diversified fund. Prospective investors who are uncomfortable with an investment that will fluctuate in value should not invest in the Fund.
Investments cannot be made in an index. Unmanaged index returns do not reflect any fees, expenses or sales charges.
Past performance is no guarantee of future results.
7167-NLD-6/18/2018